ElasticSearch internals monitoring by Zabbix (v2 traps)
6 Dec 2014 #linux#zabbixHere is more resource oriented version of ElasticSearch monitoring from previous article with using zabbix-traps. Also, it comes with very basic template, which was so asked in comments:
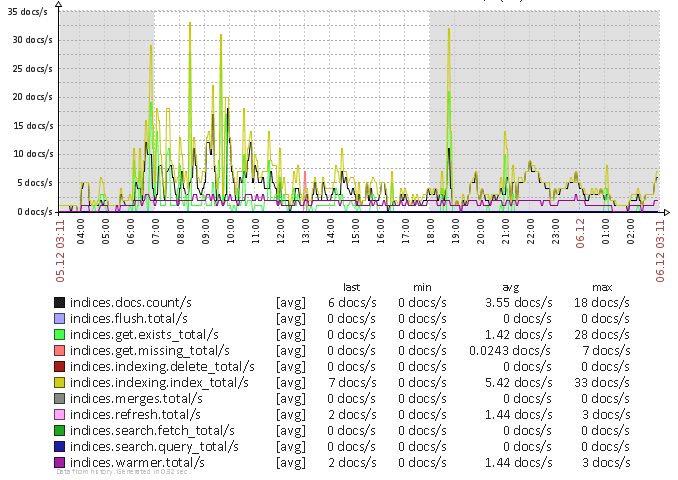
Graphs included:
- Shard’s nodes status
- Indices tasks speed
- Indices tasks time spend
Installation:
- Save this as
/etc/zabbix/zabbix_agentd.d/elasticsearch.conf:
#Key jvm.uptime_in_millis used to trigger trap sending
UserParameter=es[*],/etc/zabbix/elasticsearch.py $1
- And here is the data-getter:
/etc/zabbix/elasticsearch.py - Then import template:
template_app_elasticsearch.xml
How to add a new counter:
- Browse JSON output of your server’s:
curl http://localhost:9200/_nodes/_local/stats?all=true - Write path to value of interest using dot as separator, for example:
indices.docs.count - Create new counter in zabbix with:
key name = es[path.you.found]
andtype = zabbix_trap
And here is the difference from previous version:
Please note that you also need to add this path to counter to traps2 section of elasticsearch.py file. Then execute elasticsearch.py without any parameters and debug of zabbix_sender should be written to console. In top section you should find your new counter key (if it isn’t - key is not found or empty in JSON output), and in bottom section number of failed items should be zero (if it isn’t - there is no such key for this server configured in zabbix web)
Comments imported from blogger:
Just a usual monitoring of remote host by zabbix-agent. Something like this:
- install zabbix-agent on remote host
- add this host to zabbix-server, add it to some "generic linux template" and check that basic data started to collect (zabbix-agent must return the same "hostname" as it is configured for this host on zabbix-server side)
- then proceed with expanding data with elasticsearch checks - import template from this article on zabbix-server side, and add it to your host
- on host side configure
/etc/zabbix/zabbix_agentd.d/elasticsearch.conf and
/etc/zabbix/elasticsearch.py
So, the template should be installed only once on server side, and then assigned to hosts needed. But config for agent-check and script to collect the data should be installed on each elasticsearch host (and they are sending data about localhost back to zabbix-server)
when I run script I get this error:
12539:20150107:102815.007 item "nw-esclient-201.prod.pcln.com:es[jvm.uptime_in_millis]" became not supported: Received value [File "/usr/local/zabbix/bin/elasticsearch.py", line 22 "status", ^SyntaxError: invalid syntax] is not suitable for value type [Numeric (float)]
Maybe there is some EOL issue when you'd downloaded the script?
What is shown when you try:
# python elasticsearch.py
?
bash-4.1$ python elasticsearch.py
File "elasticsearch.py", line 22
"status",
^
SyntaxError: invalid syntax
Dunno, syntax looks valid. At least for python2 i have installed at my home box (there is no elasticsearch)
# wget https://github.com/sepich/zabbix/raw/master/elasticsearch.py &>/dev/null
# python elasticsearch.py
Unable to load JSON data!
So, no any syntax errors. What's your OS and python?
Thanks for helping out, OS=Red Hat Enterprise Linux Server release 6.5
with Python 2.6.6
Hi Tom,
add None value to all keys in traps1 and traps2 dictionaries
ie. (line 22) "status": None,
Worked for me on same environment
Thanks Federico, that helped:
bash-4.1$ ./elasticsearch.py jvm.uptime_in_millis
10116541216
But this errors:
bash-4.1$ ./elasticsearch.py jvm_heap_p_used
zabbix_sender [18783]: Warning: [line 1] '-' encountered as 'Hostname', but no default hostname was specified
Sending failed.
Hi,
Can you help me:
Traceback (most recent call last):
File "./elasticsearch.py", line 70, in
main()
File "./elasticsearch.py", line 64, in main
stats=stats[c.pop(0)]
UnboundLocalError: local variable 'stats' referenced before assignment
There is no such code (stats=stats[c.pop(0)]) anywhere in file:
https://github.com/sepich/zabbix/blob/master/elasticsearch.py
Maybe you are trying with some older version?
Could you try with the latest?
Hi There,
This is a great solution, thank you for sharing. I have a small problem with it. elasticsearch.py script runs OK on my other nodes but on my master node, it returns "Unable to load JSON data!" error. I don't know python therefore cannot really figure out what the code does but I assume something fails here:
for node_id in all['nodes']:
if all['nodes'][node_id]['host'].startswith(os.uname()[1]):
node = all['nodes'][node_id]
if len(sys.argv) == 1:
print "node found"
except:
print "Unable to load JSON data!"
sys.exit(1)
Any ideas?
Looks like cluster node name differs from hostname on that server. Tell me what are they and I'll think how script should be modified to handle this
Hmm, that's strange :) I have the same naming convention on all nodes.
hostnames: eslog001.abc.local to eslog005.abc.local (first one is the master and the problem is there)
Node names: ES_ONE, ES_TWO, ES_THREE, ES_FOUR, ES_FIVE
In this case it should not work on other nodes too ;)
if all['nodes'][node_id]['host'].startswith(os.uname()[1]):
Basically what this code does - it search all cluster nodes looking for that which starts with current hostname. So, for eslog001.abc.local hostname would be eslog001.
If your cluster nodes names are not equal to hostnames - you can just hardcode it in script like this:
if all['nodes'][node_id]['host'].startswith('ES_ONE'):
This is really strange. I have created a script as you advised with the hard coded node address and hard coded node name. It still does not work on the problematic server (unable to load JSON) but if I run the exact same script on others with the problematic server's address and name hardcoded, it works :)
Actually python scripts are not so hard in debugging
Just open python prompt:
# python
And then copy-paste everything from script which is above
def main():
line (actually only imports and getKeys needed here). Then copy-paste beginning of main():
f = requests.get("http://localhost:9200/_cluster/health")
health = f.json()
f = requests.get("http://localhost:9200/_nodes/_local/stats?all=true")
all = f.json()
Now we are coming to problem place. Let's check what nodes are exist in health report:
>>> for node_id in all['nodes']: print all['nodes'][node_id]['host']
there should be all nodes names printed out. And we looking here for current server, with this name:
>>> print os.uname()[1]
Do you see some node in previous output with name starting with exact same characters?
Oh, I've remember that error was "Unable to load JSON data!", so it is exception during one of those commands execution. When you did copy-paste lines from script - where do you saw errors?
Hi
I have tried using this script but keep getting this error when I run it:
File "/etc/zabbix/elasticsearch.py", line 22
"status",
^
SyntaxError: invalid syntax
Hi all,
If you receive the error "Unable to load JSON data!" try running the command:
curl -XGET 'http://localhost:9200/_cluster/health'
In my case, the elasticsearch process was not listening on localhost (127.0.0.1) and I got the error:
curl: (7) couldn't connect to host
Then making a "sudo netstat -ntlp" revealed the IP address and port elasticsearch is listening to and replacing "localhost" with this IP address in the script solved the problem.
zabbix_sender [6743]: DEBUG: answer [{"response":"success","info":"processed: 0; failed: 33; total: 33; seconds spent: 0.000243"}]
info from server: "processed: 0; failed: 33; total: 33; seconds spent: 0.000243"
sent: 33; skipped: 0; total: 33
Hello.
I performed the process but do not have the /etc/zabbix/zabbix_agendtd.d directory, just /etc/zabbix/agentd_conf.d.
Use version 2.4 of zabbix, but monitoring is not bringing any results.
Can you help me?
Sure, you need to use '/etc/zabbix/agentd_conf.d' folder if it is in your /etc/zabbix/zabbix_agent.conf 'Include' statement
Tks for your fast reply.
Look that:
/etc/zabbix/zabbix_agentd.conf, is all right.
### Option: Include
# You may include individual files or all files in a directory in the configuration file.
# Installing Zabbix will create include directory in /etc/zabbix, unless modified during the compile time.
#
# Mandatory: no
# Default:
# Include=
# Include=/etc/zabbix/zabbix_agentd.userparams.conf
# Include=/etc/zabbix/zabbix_agentd.conf.d/
Include=/etc/zabbix/zabbix_agentd.conf.d/
I also changed the /etc/zabbix/elasticsearch.py
cfg = '/etc/zabbix/zabbix_agentd.conf.d' # path to zabbix-agent config
Nothing ocurrs
Did you tried to run:
# /etc/zabbix/elasticsearch.py
Did you tried to run:
# zabbix_agentd -k 'es[indices.docs.count]'
What are the results?
one bug, it doesn't find the node if the case is difference between the hostname and the node name, inserting a couple of .lower() into the comparison fixes that
I also think it's a good idea to modify line 72 to be:
out += "{0} es.{1} {2}\n".format(os.uname()[1],t,s)
Runnig /etc/zabbix/elasticsearch.py, nothing occurs.
The other command return these result:
aryel@backend-elasticsearch-dev-data-igm-pri-instance-l7d5:/usr/sbin$ ./zabbix_agentd -t 'es[indices.docs.count]'
es[indices.docs.count] [m|ZBX_NOTSUPPORTED]
Retrying the command:
- es.status 503
- es.indices.search.fetch_total 0
- es.indices.merges.total 11950
- es.indices.refresh.total_time_in_millis 1394850
- es.indices.indexing.index_time_in_millis 372322
- es.os.mem.actual_used_in_bytes 3064516608
- es.indices.merges.total_time_in_millis 3231557
- es.indices.flush.total 253
- es.indices.indexing.index_total 328279
- es.indices.indexing.delete_total 0
- es.indices.docs.deleted 0
- es.jvm.mem.heap_committed_in_bytes 3203792896
- es.indices.indexing.delete_time_in_millis 0
- es.indices.get.missing_total 0
- es.indices.search.query_time_in_millis 0
- es.indices.get.exists_time_in_millis 0
- es.indices.search.fetch_time_in_millis 0
- es.indices.search.query_total 0
- es.indices.docs.count 573692
- es.jvm.mem.heap_used_in_bytes 756227784
- es.indices.refresh.total 108393
- es.indices.store.throttle_time_in_millis 25133
- es.indices.warmer.total_time_in_millis 1250
- es.indices.get.exists_total 0
- es.indices.get.missing_time_in_millis 0
- es.indices.flush.total_time_in_millis 15132
- es.os.mem.actual_free_in_bytes 4799635456
- es.indices.warmer.total 5491
ZBX_NOTSUPPORTED - means zabbix agent does not know what 'es[]' item key mean. Agent should be restarted after you put config file in place.
- es.indices.merges.total 11950 ... - means data is collecting ok.
I reinstall the agent, but anything still wrong
Could you help me?
aryel@backend-elasticsearch-dev-data-igm-pri-instance-l7d5:/etc/zabbix$ ./elasticsearch.py
node found
- es.status yellow
- es.unassigned_shards 0
- es.active_primary_shards 10
- es.initializing_shards 1
- es.active_shards 19
- es.relocating_shards 0
- es.indices.search.fetch_total 0
- es.indices.merges.total 13889
- es.indices.refresh.total_time_in_millis 1618108
- es.indices.indexing.index_time_in_millis 441191
- es.os.mem.actual_used_in_bytes 3084935168
- es.indices.merges.total_time_in_millis 3596862
- es.indices.flush.total 311
- es.indices.indexing.index_total 395003
- es.indices.indexing.delete_total 0
- es.indices.docs.deleted 0
- es.jvm.mem.heap_committed_in_bytes 3203792896
- es.indices.indexing.delete_time_in_millis 0
- es.indices.get.missing_total 0
- es.indices.search.query_time_in_millis 0
- es.indices.get.exists_time_in_millis 0
- es.indices.search.fetch_time_in_millis 0
- es.indices.search.query_total 0
- es.indices.docs.count 401643
- es.jvm.mem.heap_used_in_bytes 1063793304
- es.indices.refresh.total 124231
- es.indices.store.throttle_time_in_millis 94
- es.indices.warmer.total_time_in_millis 2
- es.indices.get.exists_total 0
- es.indices.get.missing_time_in_millis 0
- es.indices.flush.total_time_in_millis 17301
- es.os.mem.actual_free_in_bytes 4779216896
- es.indices.warmer.total 19
zabbix_sender [2106]: DEBUG: answer [{"response":"success","info":"processed: 0; failed: 33; total: 33; seconds
spent: 0.000331"}]
info from server: "processed: 0; failed: 33; total: 33; seconds spent: 0.000331"
sent: 33; skipped: 0; total: 33
Hi there, I had elasticsearch 1.5 and this script was working like a charm but after update to elasticsearch 2.0 it stopped working and giving this error:
Traceback (most recent call last):
File "/etc/zabbix/elasticsearch.py", line 117, in
main()
File "/etc/zabbix/elasticsearch.py", line 94, in main
out += getKeys(node,traps2) #getting stats values
UnboundLocalError: local variable 'node' referenced before assignment
I don't see any difference in the output of http://localhost:9200/_nodes/_local/stats?all=true
Any idea?
I've found the issue. Previously I was using hostnames now I am using IP addresses. I forgot to change this in the script. :)
Having a problem.
If i run the script directly as root or zabbix (with shell)
./elasticsearch.py `hostname`
: No such file or directory
or ./elasticsearch.py
: No such file or directory
If I run it as python ./elasticsearch.py it procudes the output fine.
suggestions
if I run it manually just once the graphs build without issue, so added a cronjob to give it a kick
I still dont understand exactly why this is.
Please consider Elasticsearch 2.0 compatibility patch:
https://github.com/islepnev/zabbix/commit/f413717ce5c3a4b9ead0c8f417a2ba2a53
6b78d9
Please consider Elasticsearch 2.x compatibility patch:
https://github.com/islepnev/zabbix/commit/f413717ce5c3a4b9ead0c8f417a2ba2a536b78d9
Dear Sepa, please explain how do you make your script send traps periodically? It works fine once, but then nothing happens. Do you use cron to schedule it?
There is one 'active check' which is sending traps when it is requested by agent. You see there is even note about it in elasticsearch.conf:
#Key jvm.uptime_in_millis used to trigger trap sending
So you can tune time period for this active check to also change period when traps are send.
I didn't get sorry,
I put
sudo zabbix_agentd -t 'es[jvm.uptime_in_millis]'
and get
elasticsearch% sudo zabbix_agentd -t 'es[jvm.uptime_in_millis]'
es[jvm.uptime_in_millis] [t|8242898]
and that's all, zabbix_agentd doesn't start with this parametr
Well, finally I get the thing. I added jvm.uptime_in_millis param to trap list that is sended to server in .py file and set time period for this trap, which is actually Zabbix agent (active)
Hi, can you give me some more hints about this, please? I added to traps:
out += "- {0} {1}\n".format("es[jvm.uptime_in_millis]","5000")
but I still don't get how this is supposed to work.
So i have tried, lets call it option 1
"jvm.mem.heap_used_in_bytes",
"os.mem.actual_free_in_bytes",
"os.mem.actual_used_in_bytes",
"jvm.uptime_in_millis",
and this option 2
"jvm.mem.heap_used_in_bytes",
"os.mem.actual_free_in_bytes",
"os.mem.actual_used_in_bytes",
"es[jvm.uptime_in_millis]",
Changed the key on the Zabbix server to match both the above.
Get this if i use the first option i try
zabbix_sender [21571]: DEBUG: answer [{"response":"success","info":"processed: 33; failed: 1; total: 34; seconds spent: 0.000328"}]
info from server: "processed: 33; failed: 1; total: 34; seconds spent: 0.000328"
sent: 34; skipped: 0; total: 34
I get this result on option 2
zabbix_sender [19248]: DEBUG: answer [{"response":"success","info":"processed: 33; failed: 0; total: 33; seconds spent: 0.000305"}]
info from server: "processed: 33; failed: 0; total: 33; seconds spent: 0.000305"
sent: 33; skipped: 0; total: 33
for the life of me i cant get it to update the trap stats automatically, does a great job if I run the script manually.
is there a bug somewhere?
Hi,
i am struggeling with the elasticsearch.py.
Everything works well since month with RHEL6.4, zabbix 2.4 client; Java 1.7 and Elasticsearch 1.2.4
Now we upgrade and have RHEL6.7, zabbix Client 3.0.4, Java 1.8 and ES 2.1.2
In this new enviroment elasticsearch.py does not return any info when startet from the commandline. It does in the old enviroment. Do you have any idear what i can do to get this working?
Hi, Can you please add the steps to monitor another host instead of localhost .
if i want to monitor like 10.0.1.10 host from my zabbix server 10.0.1.5, so what steps i need to do on remote host and zabbix server as well.