ElasticSearch internals monitoring by Zabbix
15 Feb 2014 #linux#zabbixNOTE: New version of this article with use of zabbix_traps is here
There are quite a lot of Zabbix monitoring agent extensions for ElasticSearch monitoring. But they are limited and provide just some predefined counters. What if you need to collect internal data?
This in-detail data is displayed in ElasticSearch management interface, and provided in JSON by backend. You can preview it using any browser, just open:
http://servername:9200/_cluster/nodes/stats?all=true
Here is JSON browser from Firefox’s Firebug:
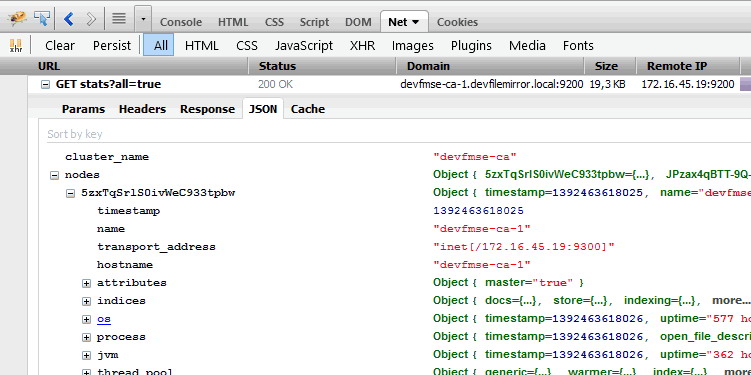
As you can see, there are indeed a lot of internal detailed counters. It’s easy now to write Zabbix agent extension, to load JSON url, parse it, get needed counter and provide to Zabbix. Just a little issue here - if you need to check 70 different counters, then page will be downloaded 70 times. So, let’s do some caching of downloaded data for 30sec in tmpfs then.
Save this as /etc/zabbix/elasticsearch.py:
#!/usr/bin/env python

import urllib
import json
import sys, os, time

def main():
    # Usage: %s [url] path.counter.name
    # [url] ='all' by default
    urls = { 'all'    : "http://localhost:9200/_cluster/nodes/stats?all=true",
             'health' : "http://localhost:9200/_cluster/health" }
    if len(sys.argv) < 2:
      sys.exit('Usage: %s [url] path.counter.name' % sys.argv[0])

    # parse command line
    if len(sys.argv) > 2 and sys.argv[1] in urls:
      ty  = sys.argv[1]
      url = urls[ty]
      cnt = sys.argv[2]
    else:
      ty  = 'all'
      url = urls[ty]
      cnt = sys.argv[1]

    # download url with caching
    tmp = '/tmp/es_stats_'+ty
    try:
      if os.path.isfile(tmp) and (os.path.getmtime(tmp) + 30) > time.time():
        f = file(tmp,'r')
        body = json.load(f)
        f.close()
      else:
        f = urllib.urlopen(url)
        body = f.read()
        f = file(tmp,'w')
        f.write(body)
        f.close()
        body = json.loads(body)

    except:
      out = '0'

    else:
      # get results for current node from cluster results
      if ty == 'all':
        for node_id in body['nodes'].keys():
          if body['nodes'][node_id]['name'] == os.uname()[1]:
            stats = body['nodes'][node_id]
      else:
        stats = body

      # JVM counters calculations
      if cnt == 'jvm_heap_p_of_RAM':
        out = str(100*float(stats['jvm']['mem']['heap_committed_in_bytes'])/(stats['os']['mem']['actual_used_in_bytes'] + stats['os']['mem']['actual_free_in_bytes']))
      elif cnt == 'jvm_p_heap_used':
        out = str(100*float(stats['jvm']['mem']['heap_used_in_bytes'])/stats['jvm']['mem']['heap_committed_in_bytes'])

      # direct value
      else:
        c=cnt.split('.')
        while len(c):
          stats=stats[c.pop(0)]
        out = str(stats)

    print out

if __name__ == "__main__":
    main()
And create extension for agent /etc/zabbix/zabbix_agentd.d/elasticsearch.conf:
# Key syntax is es.json[page, counter].
# Page = "all" or "health". Default is "all", optional
# Counter is json path to counter value like indices.search.query_total and is mandatory
UserParameter=es.json[*],/etc/zabbix/elasticsearch.py $1 $2
Some preparations:
chmod +x /etc/zabbix/elasticsearch.py
/etc/init.d/zabbix-agent restart
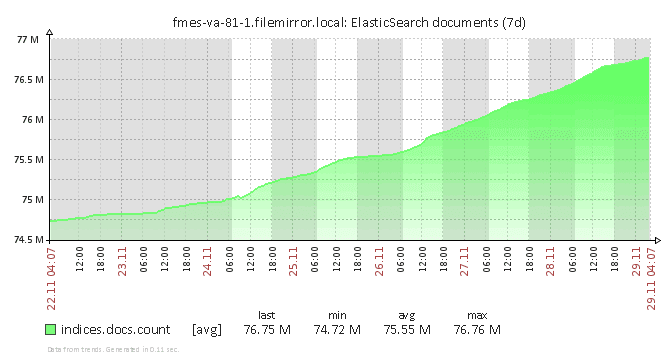
And we are good to go, just provide JSON path to any counter needed divided by dot (.)

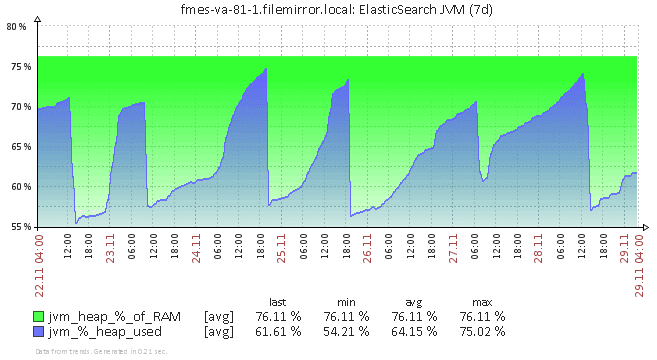
Also, there are some additional JVM online calculated counters provided by script:

With such result:
Comments imported from blogger:
Great script! FYI, your script assumes that your node name matches your host name, in our environment it does not and I was getting the following error:
Traceback (most recent call last):
File "/etc/zabbix/bin/elasticsearch.py", line 68, in
main()
File "/etc/zabbix/bin/elasticsearch.py", line 62, in main
stats = stats[c.pop(0)]
UnboundLocalError: local variable 'stats' referenced before assignment
I updated the line:
if body['nodes'][node_id]['name'] == os.uname()[1]:
to
if body['nodes'][node_id]['hostname'] == os.uname()[1]:
so that it would work for me. Thanks again!
Can you provide Zabbix template please? XML export of template that you use and have this graphs from?
Can't generate data. Erro: "Received value [] is not suitable for value type [Numeric (unsigned)] and data type [Decimal]
Thank you all for feedback,
I've published new version of this script:
https://alex.ryabov.dev/2014/12/elasticsearch-internals-monitoring-by.html
Some bugs were fixed, basic template included.
It is client part.
For server part template see the new version of article:
https://alex.ryabov.dev/2014/12/elasticsearch-internals-monitoring-by.html
Do you have a zabbix template also ?