RabbitMQ internals monitoring by Zabbix
30 Nov 2014 #linux#zabbixContinuation of extending zabbix-agent to monitor internals of applications. Now it’s a RabbitMQ turn:
What’s supported:
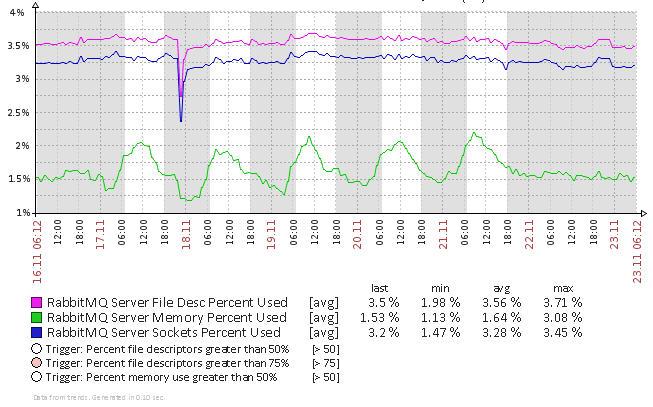
- File descriptors, Memory, Sockets watermarks monitoring
- Low level discovery of vhosts/queues
- Monitoring for messages, unack, consumers per queue
- Triggers for important counters
- Data sent in chunks, not one by one, using zabbix traps
Installation:
- Save this as
/etc/zabbix/zabbix_agentd.conf.d/rabbitmq.conf:# rabbitmq[server,uptime] will trigger trap sending # run '/etc/zabbix/rabbitmq.py server uptime debug' - to debug trap sending UserParameter=rabbitmq[*],/etc/zabbix/rabbitmq.py $1 $2 - Which will call this data-getter:
/etc/zabbix/rabbitmq.py - Import template
template_app_rabbitmq.xml
Notes:
- Queues statistic is per-cluster and not per-server. This mean that having cluster of three nodes, all of them will have equal graphs for queues. So, there is line 31 in rabbitmq.py which states:
if not socket.gethostname().endswith("-1"): return [] #only discover queues on first node
We have naming convention like node-1, node-2 - and discovering queues only on first node. Remove/modify this line if it is not your case
- Data about queues is sent as zabbix traps to lower bandwidth and system load.
To troubleshootzabbix_senderrun script manually as:
/etc/zabbix/rabbitmq.py server uptime debug
Comments imported from blogger:
Hi! Your graph is very beautiful !!! :D
I want the same... :D i followed all your steps and from Zabbix frontend i get no data about RabbitMQ Server (Server Disk, File Desc, Sockets...) Could you please help?
>Which will call this data-getter
/etc/zabbix/rabbitmq.py
Link is leading to https://github.com/sepich/zabbix/raw/master/elasticsearch.py
Thanks for your work by the way.