MySQL internals monitoring by Zabbix
1 Dec 2014There are a lot of examples how to monitor MySQL internal by zabbix-agent, like:
- http://wiki.enchtex.info/howto/zabbix/advanced_mysql_monitoring
- https://www.zabbix.com/wiki/doku.php?id=howto/monitor/db/mysql/extensive_mysql_monitoring_including_replication
- https://www.zabbix.com/forum/showthread.php?t=20488
but you know - the main issue is NIH ;) Those solutions are too heavy and use dependencies like php. Also, mysql SHOW GLOBAL STATUS provides with hundreds of values, and its hard to select ~50 of most valuable ones. Last link is the best solution found, I’ve updated it a little:
- Fast and light - only one bash file
- Zabbix traps are used to send data in one chunk, lowering system load and bandwidth
- 45 items, 13 triggers, 11 graphs
Installation:
- Save this as /etc/zabbix/zabbix_agentd.conf.d/mysql.conf
# mysql[uptime] or mysql[max_connections] will trigger trap sending
# run '/etc/zabbix/mysql.sh uptime debug' to debug trap sending
UserParameter=mysql[*],/etc/zabbix/mysql.sh $1 $2
- Download and save data-getter
/etc/zabbix/mysql.sh - Import template
template_app_mysql.xml
Notes:
- Triggers are mostly paranoid, so be ready to understand what they measure and fix.
If not - just disable them - All values are of type “zabbix trap” except for
uptimeandmax_connections
uptimeis “zabbix active check” and checked each 5min by default, at this time all status traps are sent
max_connectionsis checked hourly, at this time variables traps sent - So, if you want to check additional status counter - you would need to create zabbix-trap counter in web interface, and then add the same counter to script ‘status’ array to send it
- Some graphs in templates provided are of type “logarithmic”, fix template in notepad, or install zabbix patch
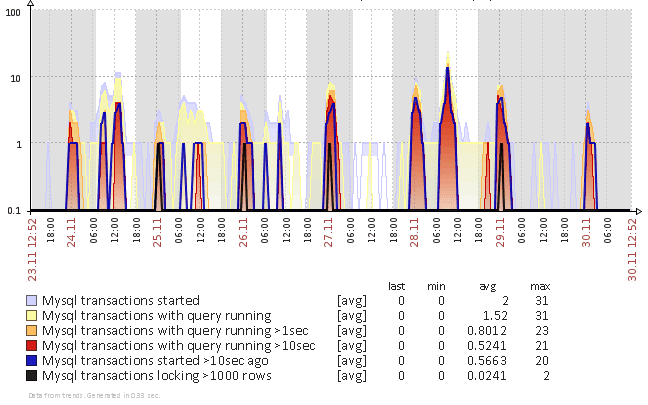
- Also there is some extra bonus lines in script at the end. They are used for additional template “transactions/locks analyze”. You can download it here (screenshot below):
template_app_mysql_transactions.xml