Zabbix vs Graphs
7 Aug 2016 #nginx#zabbixThis is english version of my publication: https://habr.com/ru/articles/275737/
Zabbix makes it easy and convenient to set up monitoring for a large number of different metrics from multiple devices. It was released under GPL in 2001, and over the past 15 years, numerous improvements have undoubtedly been made, allowing for even better data collection on a larger scale.
But why have all these improvements overlooked navigation through such a vast number of collected graphs and their display?
What we have now
The main purpose for which Zabbix is used in our company is trend evaluation rather than current alerts and triggers. That is, we primarily need to quickly open all graphs for a single server when issues happen, or the same graph across a group of servers.
What does the standard zabbix-frontend-php offer us for this?
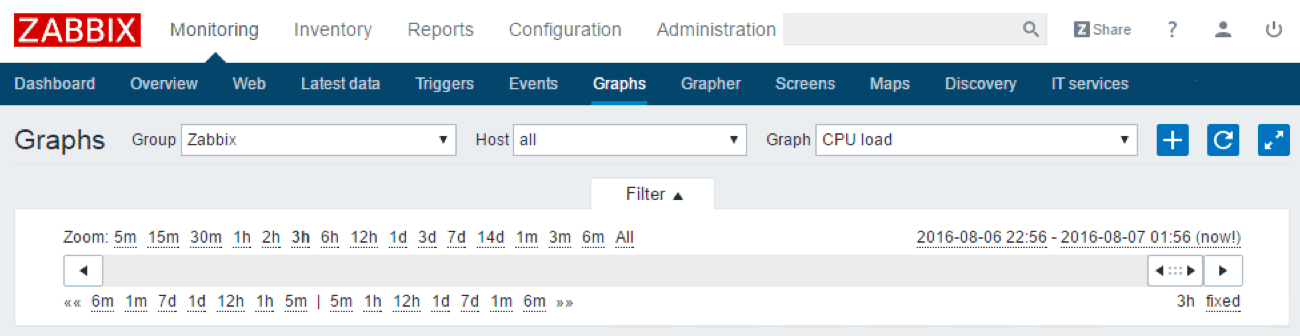
Not so much! You are allowed to select a group, then choose a host from it, and then pick a graph for that host. Each selection triggers a full page reload, and even though there is an all option – only one graph will still be displayed.
You might say that the solution to this problem is Screens, which need to be pre-created with graphs of type Dynamic item. Unfortunately, this approach only adds problems when you simply need to open the right Screen from a list of “over 9000”(c) in a plain list.
Have you ever tried quickly opening a Screen created on a host via a template? Then switching to a neighboring host?
Server-side graphs
The problem has been acknowledged by users, and feature requests for graph display are among the top requests in JIRA by developers. And users are not just requesting – they are hacking solutions themselves. In ZBXNEXT-75, a patch was found (dating back to 2006) that adds what seems like an obvious feature:
If we select a group in graphs, then choose a server from it but leave the graph option as all, all graphs for that host will be displayed on one page. The same applies to selecting a specific graph but setting the server name to all – the chosen graph will be displayed for all servers in the group.
This seems so logical that it should be available “out of the box”!
Cristian added a comment - 2013 Dec 04 18:44
Btw, I simply don’t understand why this patch is not included into Zabbix source. The code is quite simple and these (very useful) patches are quite easy to add.
The patch was installed, and for a while, it made life easier. However, the reason why this functionality has not been officially implemented soon became apparent – server-side image generation performance is subpar. It is tolerable when there is only one image on the page, but when there are 20, it becomes noticeable.
Client-side graphs
Let’s take a moment to remember that it’s 2016, and modern, trendy systems like Graphite, Grafana, and Chronograf render graphs on the client side. Moreover, there is even a data-source plugin for Zabbix in Grafana:

This is a great opportunity to try something new with the already collected native data, to look at it from a different perspective. And due to its relative simplicity, I highly recommend doing so. A good comparison of the original capabilities and Grafana can be found in the wiki.
But unfortunately, the plugin did not work for us for several reasons:
- Very slow performance related to the capabilities of the Zabbix API. When we tried Grafana, retrieving history was initially done via a patch ZBXNEXT-1193. Even now, the API lacks downsampling. If you view a graph for a month and the counter collects data every minute, be prepared for the browser to load a JSON file with all the data and attempt to render it. Not to mention that the data size will be larger than an image would be.
- Only counters and their history values are available. All graphs created with them in Zabbix need to be recreated in Grafana as templates. With query writing, you can draw anything, but this doesn’t help when you want to quickly glance at an already created set of graphs.
That is, we would like something more integrated into Zabbix since its template inheritance system is quite convenient. It’s a pity that the 2013 initiative to transition rendering to D3.js failed. Yes, zabbix-d3 works, but it encounters the same architectural limitations of the API. We can only hope that the many ZBXNEXT requests created to support D3 will eventually be implemented. This will also improve Grafana and its potential competitors in the future. (Developers, don’t miss your chance to break free from the nearly adult PHP code!)
Server-side graphs #2
Different companies have tackled the problem of graphs in Zabbix in different ways. For example, Ring Central among other things built a separate farm for rendering graphs.
With a dedicated web interface for navigating and viewing them:
(A high-quality screenshot was provided by the author @TPAKTOP_666, who responded after the article was published.) Some information about the tool is available in a slideshare presentation, and some in a talk at ZabbixConf. I found no further open-source details, but it’s clear that the tool allows the creation of graphs from any counters, even those not previously combined in a single graph. The ability to send a link to a generated set of graphs also seems interesting.
The idea of offloading image rendering to a farm of servers seemed like a simple brute-force solution and was tested. Combined with caching in nginx and migrating to PHP 7, this resulted in some performance gains—enough to reconsider improving navigation in the current web interface.
The main issue with patch ZBXNEXT-75, mentioned earlier, was that the page fully reloaded every time a filter was changed. Yes, it could have been rewritten in JavaScript to fetch all necessary data from the Zabbix API on the fly—but API usage requires authentication and a token. It would be silly to ask users to enter their password twice, once for PHP and again for JavaScript.
The final piece that made everything fall into place was a wonderful script by Toshiyuki-san: zabbix-graph-viewer:
It worked without asking for authentication, and this was achieved with just one line in JavaScript:
auth: $cookies.zbx_sessionid,
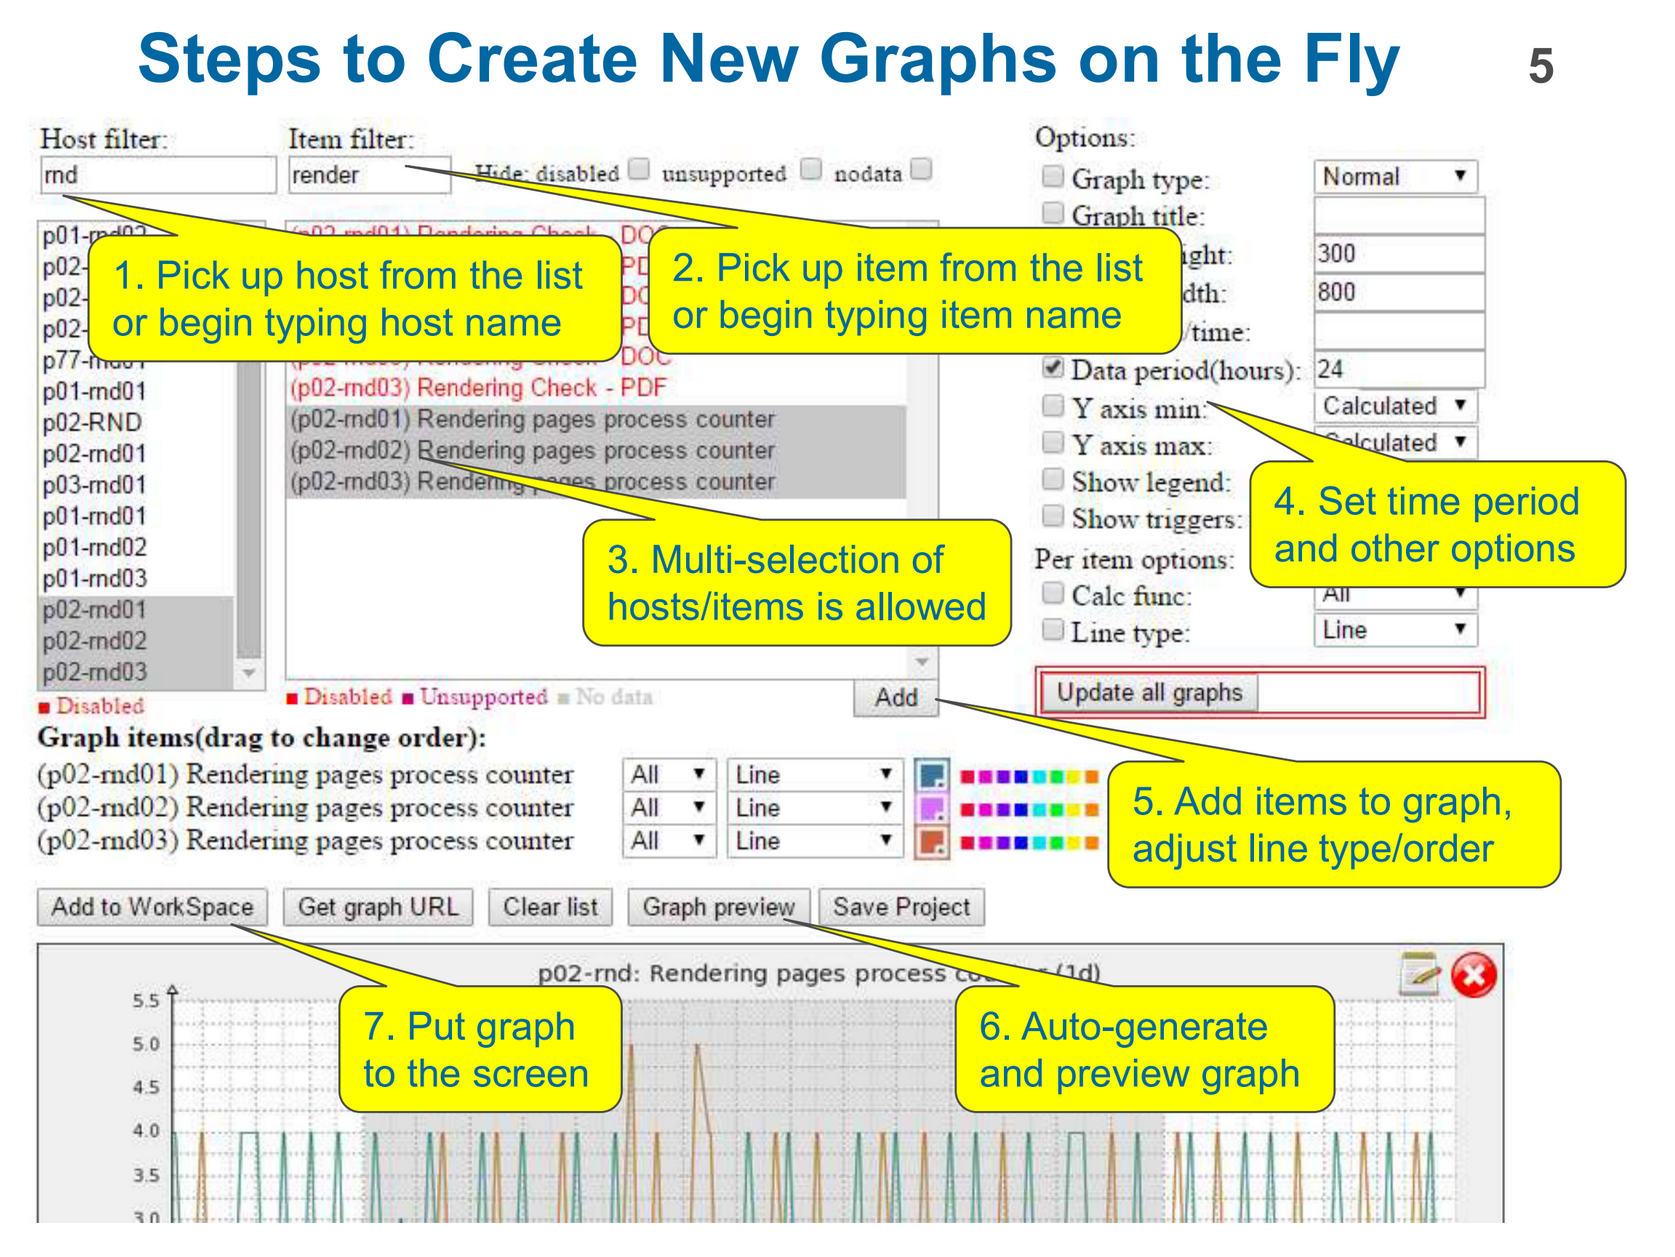
That is, the notorious token for the Zabbix API is simply the SSID, already stored in cookies. After this, it became quite easy to rewrite the idea of ZBXNEXT-75 in JavaScript. Rolling up our sleeves and zabbixGrapher appears:
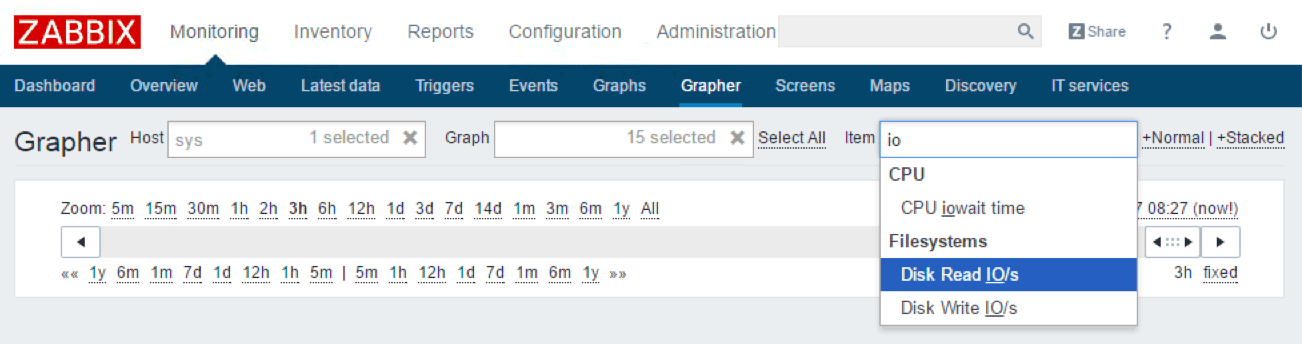
Besides viewing arbitrary pre-created graphs by hosts, we also managed to implement the ability to create graphs for any counters on the fly. This uses HTML5 history, which changes the URL as the page state changes—allowing users to share links to their selected graphs.
LLD
The ability to generate graphs on the fly also somewhat addressed ZBXNEXT-927 (ranked #2 in JIRA). The problem is as follows:
- You have LLD (Low-Level Discovery), for example, to detect all disks on a server. It successfully creates a counter, such as
Free disk space, %for each disk. - In LLD, you can only create separate graphs for each detected disk. You cannot create a single graph displaying free space on all disks:
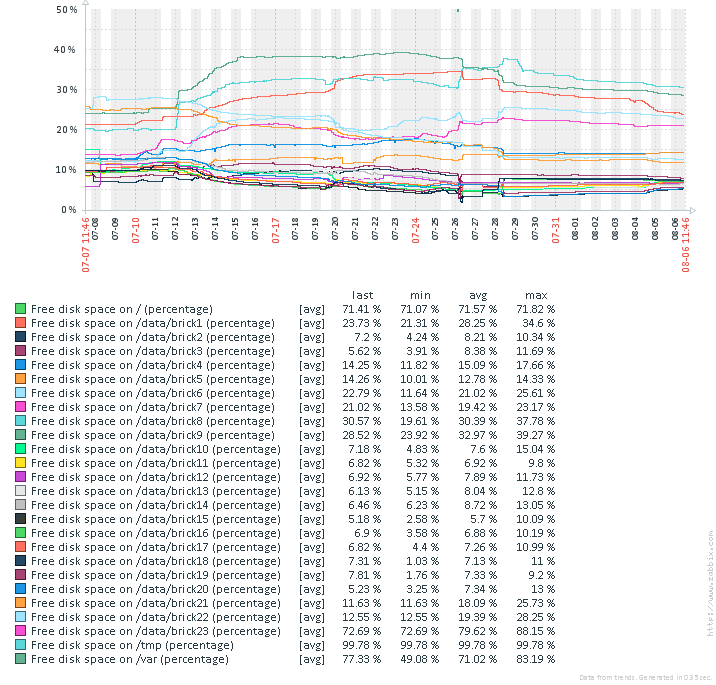
Such a graph can be manually created on a host from discovered counters. Over time, a disk might be replaced or a new one added, making the graph outdated.
Yes, since 2012, there have been scripts to automate the creation and updating of such graphs. But their main issue is that you have to remember them—for example, when creating a new template with hosts, you must also update the script’s config. It would be nice to edit the config in the same web interface. Let’s go, it’s fun! This led to the creation of gLLD
:
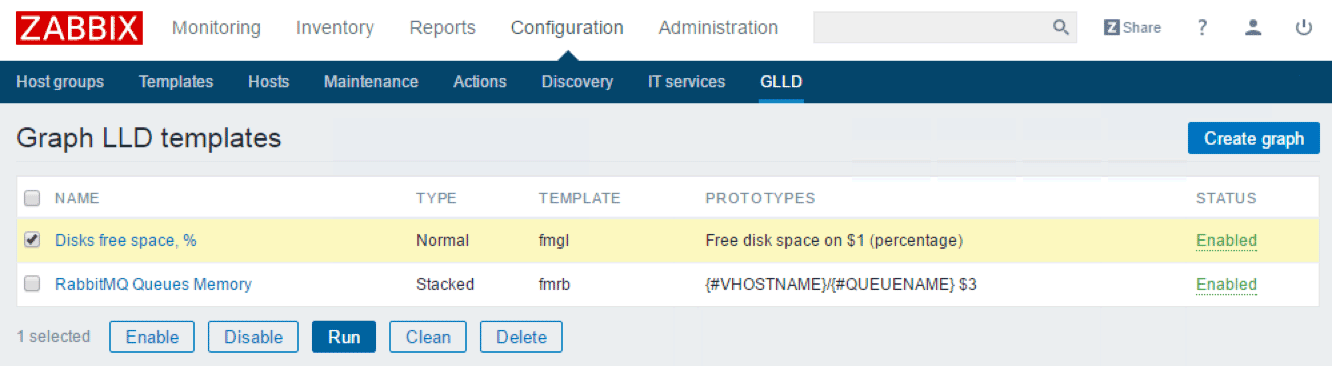
It simply allows for convenient editing of tasks that a cron-based script will execute. Writing this simple form required diving deeper into Zabbix’s web interface than the public API, and unfortunately, what I saw was not encouraging. (Not fun at all.) However, it explains why the response from developers in ZBXNEXT-927 was a link to Development services. The minimum price for current projects on this page starts at €8,000.00.
The End
That’s all for now. Hopefully, this collection helps someone (perhaps to realize it’s time to migrate from Zabbix ;)
PS
Yes, there are no plugins; you have to patch the source code. But they are coming soon—ZBXNEXT-1099